Thinly Traded Stocks - Technical Analysis
Many market pundits will insist that you can't use technical analysis on thinly traded resource stocks. They argue that if a $0.25 stock trades a few thousand shares, there may only be one or two market participants rendering a technical analysis approach invalid. Remember that if everyone tries to sell their shares at once that the stock price will plummet like WKRP turkeys being dropped out of a helicopter.
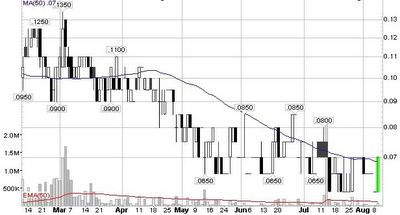
6 month daily chart
Obviously a stock that trades 5-10 times a day isn't going to reveal any secrets on a 5 minute time frame. Rather than dismiss technical analysis outright, I usually use weekly charts over a 2-5 year time. Weekly candlestick charts integrate price/volume data over longer time periods.
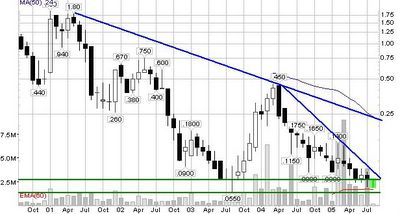
5 year monthly chart
From looking at these two charts, it becomes apparent that you need to allow for longer holding periods when you buy a thinly traded stock.
Not Advice
Try the Big Picture Speculator free for 30 days.