How Low Can You Go?
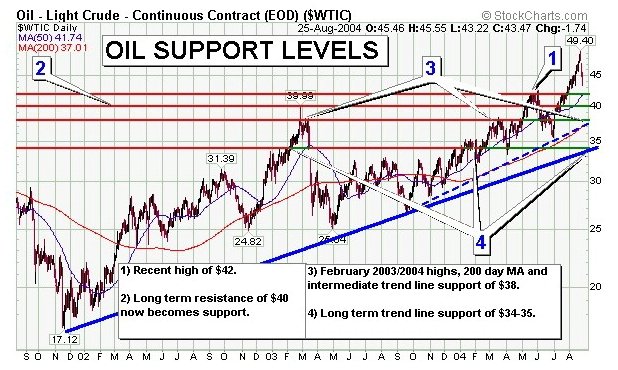
Oil Price Support Levels

Oil prices have sharply reversed their upward trend. It is at times like these that it helps to evaluate the potential downside with a How Low Can You Go Chart. The long term trend line support is at ~$35 so don't be surprised to see it tested. Having a How Low Can You Go Chart chart can mentally prepare you to make an entry at a favorable price.
We can keep an eye on natural gas prices and the Philadelphia Oil Services Index for signs of life in the energy sector but I wouldn't be shocked to see further downside.
When gold doubled topped out at the $430 level nobody was predicting that it would grind lower for 5 months. Of course the gold price is heavily manipulated by central banks so why someone would want to invest in it is beyond me.
NOT ADVICE