Oil Price Technical Analysis - Part 4
2 Year - Daily
I have posted a series of charts showing oil prices over the following time frames:
- 15 year
- 10 year
- 5 year
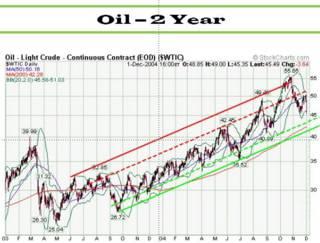
- 2 year
- 1 year
This 2 year chart shows 2 main technical levels:
- Long term resistance zone between $51-56 (red lines)
- Long term support zone between $41-44 (green lines)